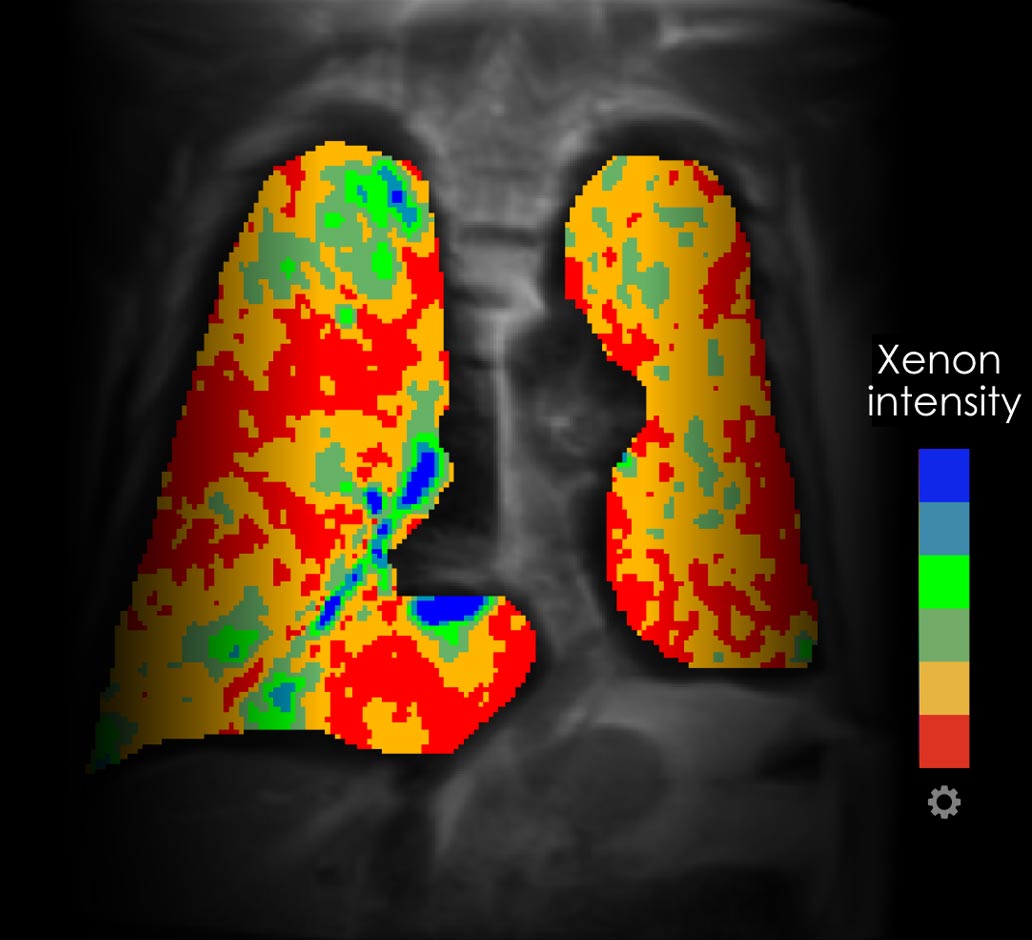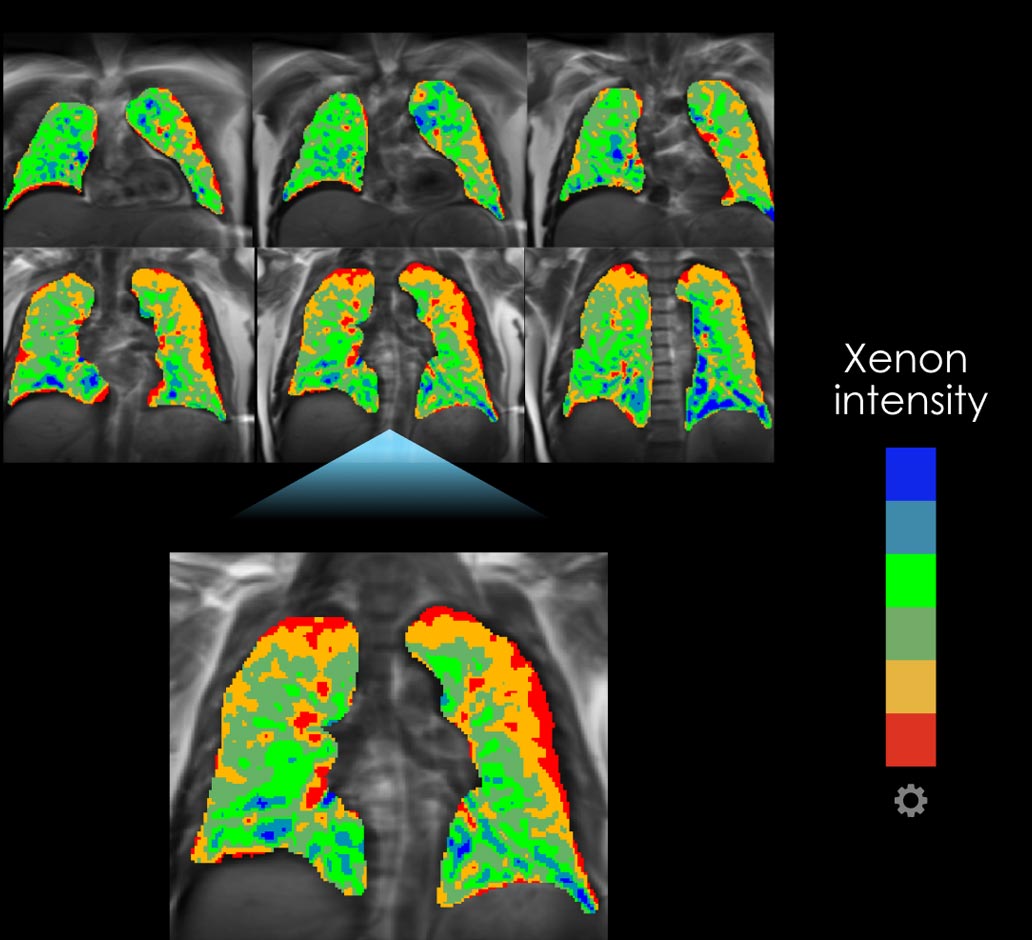
XENOVIEW® Illuminates Distribution of Gas in the Lungs

FEV1: 56%

FEV1: 69%
*Example patients from the XENOVIEW® phase 3 studies. Image shows the distribution intensity of XENOVIEW® gas. Low to high distribution follows the hot to cold spectrum (red to blue,
respectively). Image processed using XENOVIEW VPD® software.
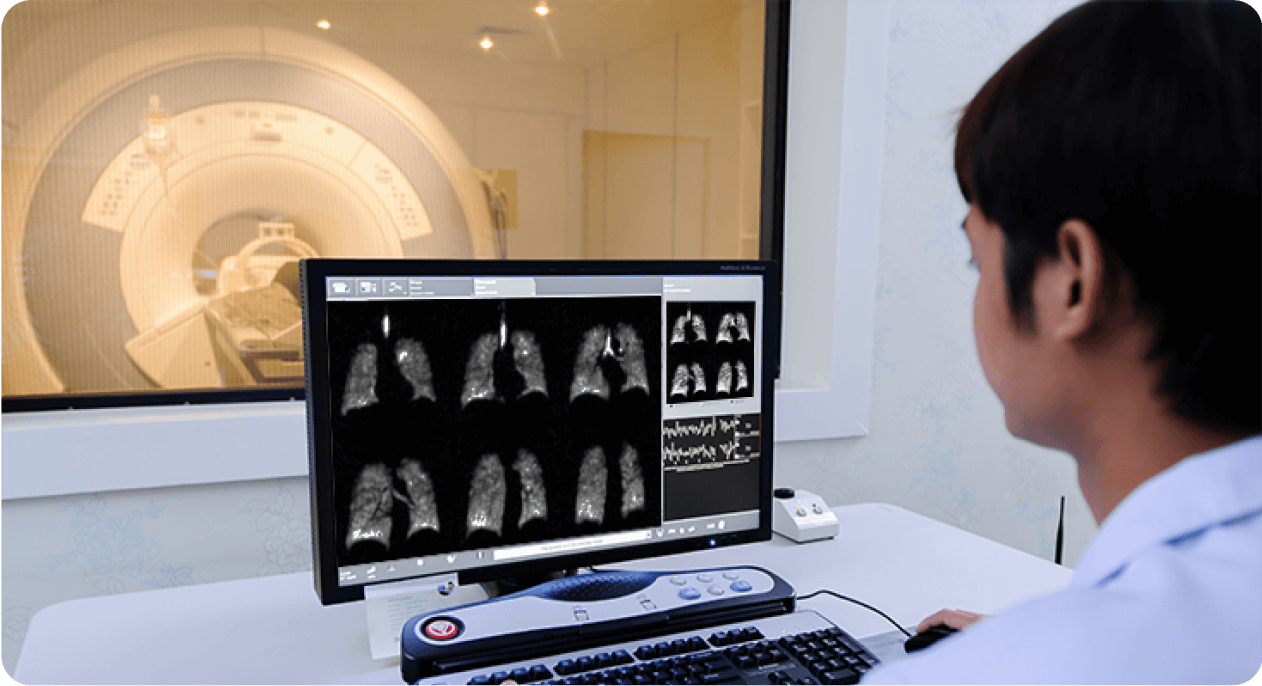
XENOVIEW® Transforms MRI Into a Lung Ventilation Imaging Platform

Not an actual technician.
- Provides direct measurement of regional lung function in patients undergoing evaluation of lung ventilation
- No radiation exposure to patient
- Spatially distributes to image the smallest airways
- Single, 10 to 15 second breath hold
- Non-effort dependent procedure
